I thoroughly enjoyed this pair of online classes from the ICAA. The planner Rodrigo Bollat Montenegro takes us on a grand tour of the urbanism of Greenwich Village, in which he touches on everything from Leon Krier’s elements of good traditional cities to the still-visible remnants of colonial property lines and century-old street extensions. 3.25 credits toward your ICAA Certificate in Classical Architecture if you complete the quiz at the end.
Part of the urban fabric of the West Village, as it stood in 1895, from a Sanborn map of Manhattan. Red is brick; yellow is wood frame; green is a special hazard (with brick or frame construction signified by dots or X’s, respectively). Evidently, the lot that now contains one of the city’s great jazz clubs, 55 Bar, was already numbered 55 Christopher Street in 1895. Next door, the building that would become the landmark Stonewall Inn, stood at 53-51. Source: New York Public Library.
Some incredible virtual modeling has been done to recreate the physical forms of old lost cities. I found a project recently that’s focused on Constantinople as it developed through the year 1200. Details include models of Hagia Sophia, the Hippodrome, the Forum of Constantine, and at least 60 other features of the ‘New Rome’ as it reached maturity. Together, these features are mapped into a 3-D layout of the city proper. This page tessellates a map of the old city (east of the Theodosian Wall, and spanning the triangular promontory between the Golden Horn and Marmara) into clickable tiles that lead to closer views.
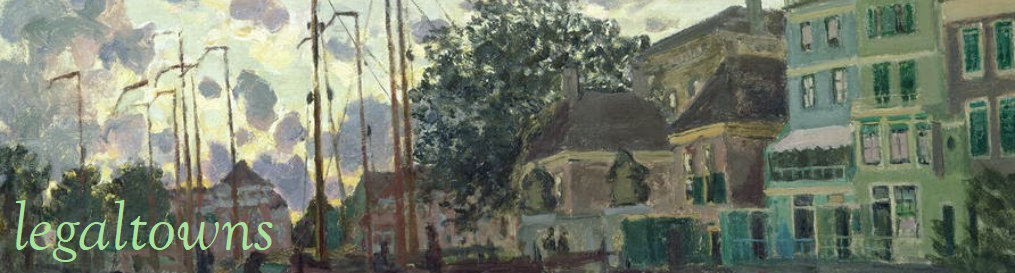
Unfortunately, for all its ambition and promise, it seems like this project may have been put on hiatus (or slowed down) several years ago. I would include some teaser images here (as allowed by the Fair Use doctrine) but (also unfortunately) the authors of the project are quite aggressive about threatening to sue anyone who uses their work without permission. So, to keep things simple, I’ve included an early 20th c. map of the city instead.
Oddly, the authors also seem quite concerned that their project should not be construed in any way against Turkey:
None of the material on this site can be used for any purpose against any country, nation or minority, especially against TURKEY and Turkish People.
Hm. Seems like there is some political tiptoeing going on.
It’s a shame that this effort has slowed down. Constantinople in its heyday deserves topographic scholarship on par with what Carandini, et al., have done for classical Rome. Regardless, what’s done of this model is already an impressive technical and historical undertaking, and given that there are few major European cities with a more rich or tragic (or extensive) history than the one we now call Istanbul, anything that sheds new light on Constantinople and its role as, essentially, a tenuous thread between classical antiquity and our modern world is, I think, a priceless cultural contribution.
Think about this: Byzantium considered itself a continuation of the Roman Empire — and, for all intents and purposes, it was. In the West, the Dark Ages may have enveloped the former Roman lands, but from its new capital at Constantinople the Roman state continued in the East with just one interruption (during the Crusades), right down to the 15th century. The people of Byzantium even called themselves Romans (in Greek, ironically; as did, apparently, many Greek-speaking people in the Ottoman Empire until the 20th century).
So Constantinople fell to the Turks in 1453 (and the Greek scholars who fled West helped seed the Italian Renaissance). And Columbus landed, just 39 years later, in Hispaniola (where Santo Domingo — a Renaissance city in the Western Hemisphere — would soon be founded). That means that there was a generation of people who were born into the Roman Empire who came to know about the European discovery of the New World in the prime of their lives. I find that fascinating. Romans who had a glimpse of America.
A sister project has also begun to model Babylon as it existed in antiquity.
An excellent exhibit at The Morgan illustrates the study of Rome by 19th-century visual artists and writers; the influence of the Grand Tour on artists of the time; and the maps and guidebooks that visitors followed. I think the images speak for themselves. My Flickr gallery has a lot more images, some of which are very close, for detail. Not too many exhibits combine ancient urban planning, Romantic-era art and writing, and 19th century cartography. We really enjoyed this one!
My interest in urbanism has recently shifted to absorbing its visual elements and textures. Working in Lower Manhattan has given me a chance to process the city’s massive urban fabric much more deeply. I use my lunch hours to explore, and I try to go slowly. Also, my S.O. lives in Battery Park City, so I’m often here in the evenings. Being in the city has led me to more photography and less writing. I’ve been able to absorb common law urbanism on a spatial, tactile level: walking the old blocks with their pavements of slate, cobblestone, and concrete; studying the varied architecture, from pitched-roof, colonial row houses to futuristic Art Deco skyscrapers; sitting on park benches in triangles and churchyards; touching the iron and stone and cement. It sometimes surprises me how much there still is to discover in this embryonic core of New York, and how the organic city still lives and exerts its patterns, in spite of all the modern forces that promote homogeneity.
Since I’ve had less to say lately, I’m going to start posting some of the pictures I’ve been taking, in place of frequent commentary. I will add links to Flickr albums with particular themes, and will backdate them to (roughly) when the pictures were taken. (I was hoping to embed entire albums directly into the LT page, but that turned out to be more time consuming than I can handle, given the amount of material I’d like to share. So, a cover photo that links to the Flickr album will have to do, for now). Hope my readers enjoy. And please do comment on the photos. : )
One last thing: if you have a Flickr or Yahoo account, please SIGN IN. Doing so will prevent you from having to occasionally click through distracting ads when navigating my albums. Thanks!
We hear more and more about the threat to coastal cities from rising sea levels. But being able to visualize the local spatial implications of this phenomenon brings it home in an entirely new way. One of the most interesting tools is the Surging Seas Risk Zone Map, from Climate Central, a Princeton-based independent organization that promotes public awareness about climate change. Here, you can search for any location, and visualize the contours of new shorelines with sea levels that have risen in increments of feet and meters.
Here’s a map of what would happen in the Newark Bay basin by 2100 if sea levels rose by more than two meters, as envisioned by a recent analysis of the potential loss of significant Antarctic ice sheets:
Urban New Jersey, plus 7 feet of sea level. Source: Climate Central, Princeton, N.J.
In this scenario, Newark Airport, the entire Seaport area, and much of the Ironbound has been flooded. In addition, Newark Bay appears to have swallowed up most of the salt meadows, and the blocks along the tidal portion of the Passaic River are under water. Finally, take a look at Hoboken and downtown Jersey City, on the far right: the Hudson River waterfront has essentially become a barrier island, while the blocks leading back toward the Palisades have been saturated.
Meanwhile, here’s a look at some of the coastal areas of New York City, under the same scenario:
Coastal New York, plus 7 feet of sea level. Source: Climate Central, Princeton, N.J.
The submerged areas on this map (e.g., the Rockaways, Coney Island, Howard Beach, Canarsie, Red Hook, and the South Shore of Staten Island) line up almost perfectly with the areas that experienced the most destruction from Hurricane Sandy in 2012.
Keep in mind that these maps offer a vision of what could happen with just a seven-foot (7′) rise in global sea levels, which is now being held out as a plausible scenario for 2100. Some of the projections to the year 2500 show global sea levels rising 49 meters.
Kevin Walsh has a useful primer on the enigmatic pattern to Queens street numbering at Forgotten NY, and how it becomes all Sorcerer’s Apprentice in one section of Maspeth.
The 1920s decision to number almost every street in Queens is a great early example of a 20th-century planning initiative where ambition outstrips logic. I mean, if the various neighborhoods of Queens had simply been allowed to retain the street names that they’d had as the towns and cities that once composed the western portion of Queens County, Long Island, then their character would have been better preserved over the years; and people would have been no more lost in Queens than they are today. Moreover, new streets could have been added to these locales with their own unique names, deepening the character of these places.
Instead, we have this:
So communities, some of which date from the time of New Amsterdam, are robbed of an important part of their history to create a system that adds almost no logic or clarity to the layout of the modern city. The irony is that the one potential benefit of this grand attempt to ensure that no two places in the borough would share the same address might have been the establishment of a unified post office for the borough. Yet Queens remains the only New York City borough without a unified post office. So, for example, people there still have their mail addressed to Long Island City, Flushing, Jamaica, or Far Rockaway, rather than, simply, Queens, New York. The legacy of the old towns survives; just not in very many meaningful street names.
I’m inclined to think that a lot of these old street names will be recovered soon, especially in historic town centers, as real estate values increase and sellers want to highlight examples of local history and character.
In contrast to the orderly subdivisions of East Coast cities, or the predictably square farms that dice up the countryside of the rural Midwest and Texas, variations on the above mish-mash can be found on tax maps throughout the Intermountain West: long, rectangular parcels — some overlapping others — with no apparent rhyme or reason. Apparently, these parcel patterns are the legal remnants of old mine claims. Here’s a map showing claims in the Leadville, Colorado vicinity as of 1880:
1880 mine claims around Leadville, Colorado. Source: David Rumsey Map Collection.
This map makes you realize how intense the American mineral rushes really were. Claims covered every inch of land in the promising places, and even overlapped each other as new claims supplanted abandoned ones — or maybe the claims just conflicted with one another in the legal vacuum of the old West. The names claimants gave their mines are usually funny — names like Dead Broke and Legal Tender, Last Chance and Grand Prize.
Apparently, the similarities between the dimensions of different miners’ claims is not coincidental: Legislation at both the federal and state levels had attempted to standardize the rules for mining claims on a number of occasions; these efforts culminated in the U.S. General Mining Act of 1872.